 Photo by
 Configuring Prometheus targets with Consul
In the last post we used the SaltStack Mine to get targets for Prometheus to scrape. This time we’ll use Consul, a service discovery tool by HashiCorp that we use heavily in all Backbeat infrastructure.
The SaltStack Mine technique is useful, but can be quite slow to update.
New IP addresses will be published to the Mine every mine_interval (e.g. 60 minutes), and Prometheus will only update when a highstate is run on the Prometheus server.
Consul gives us information far more rapidly. By configuring Prometheus with [consul_sd_configs](), we tell it how to pull addresses from Consul’s service catalog. When a new service is added to the catalog, Prometheus will start scraping it immediately.
Goal for this post
Imagine we have these servers:
lb1.example.com(10.0.0.4) andlb2.example.com(10.0.0.5) are load balancers that run HAProxy;stats.example.com(10.0.0.3) runs Prometheus;consul.example.com(10.0.0.2) runs a Consul server in a--bootstrap-expect=1setup.
Our goal is to scrape Prometheus metrics from each load balancer, using Consul to get the addresses to scrape.
To do this, we need to run a Consul agent on the load balancers and Prometheus server.
Each load balancer will register itself in Consul’s service catalog, and Prometheus will query that catalog for all addresses under the haproxy service.
HAProxy exporter
HAProxy exposes a wealth of information about itself with the stats configuration options. With haproxy-exporter we can convert these stats into a format Prometheus can consume, available over HTTP.
Note: HAProxy 2.0 has native Prometheus metrics, but we’ll assume an earlier version.
Start by updating the HAProxy configuration on each load balancer to make stats available locally:
frontend stats
    bind 127.0.0.1:8404
    stats enable
    stats uri /stats
    stats refresh 10s
Use your favourite installation process to get the haproxy-exporter binary installed to /usr/local/bin.
It’s distributed as a native binary, so installation is as easy as extracting an archive downloaded from the GitHub releases page:
curl -L -o haproxy-exporter.tar.gz https://github.com/prometheus/haproxy_exporter/releases/download/v0.10.0/haproxy_exporter-0.10.0.linux-amd64.tar.gz
tar xfv haproxy-exporter.tar.gz
mv haproxy_exporter_0.10.0.linux-amd64/haproxy_exporter /usr/local/bin/
chmod +x /usr/local/bin/haproxy_exporter
Then run the exporter as a systemd service. Here’s a simple example:
[Unit]
Description=HAProxy Exporter
Wants=network.target
After=network.target

[Service]
Type=simple
ExecStart=/usr/local/bin/haproxy_exporter --web.listen-address "10.0.0.4:9101" --haproxy.scrape-uri="http://localhost:8404/stats?stats;csv"

[Install]
WantedBy=multi-user.target
The exporter is now available on port 9101:
curl 10.0.0.4:9101

# ...
# # HELP haproxy_backend_bytes_in_total Current total of incoming bytes.
# # TYPE haproxy_backend_bytes_in_total gauge
# haproxy_backend_bytes_in_total{backend="some-app"} 748236
# haproxy_backend_bytes_in_total{backend="another-app"} 2345621
# ...
We now need to register it in the Consul service catalog so Prometheus can find it.
Create /etc/consul.d/haproxy_exporter.json:
{
  "service": {
    "name": "haproxy_exporter",
    "port": 9101
  }
}
Make sure to run Consul with -config-dir=/etc/consul.d so it will read the file when it starts.
After doing the same for the other load balancer, we should see the haproxy_exporter service in Consul:
consul catalog services
# ...
# haproxy_exporter
# ...

dig @127.0.0.1 -p 8600 haproxy_exporter.service.consul
# ...
# ;; ANSWER SECTION:
# haproxy_exporter.service.consul. 0 IN   A       10.0.0.4
# haproxy_exporter.service.consul. 0 IN   A       10.0.0.5
# ...
Consul configs
Add a new scrape config to the Prometheus configuration:
scrape_configs:
  - job_name: 'haproxy'
    consul_sd_configs:
    - server: 'localhost:8500'
      services:
        - 'haproxy_exporter'
This registers a haproxy job that will use the local Consul agent (localhost:8500) to scrape all addresses of the haproxy_exporter consul service.
Reload Prometheus and check out the targets page:
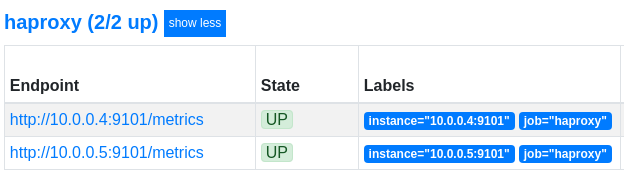
Great! The HAProxy metrics have been discovered by Prometheus.
Relabelling
As we did with Instance labelling in the last post, it’d be cool if we could show instance=lb1.example.com instead of an IP address and port.
Enter relabel_configs, a powerful way to change metric labels dynamically.
Add the following to the haproxy job:
  scrape_configs:
    - job_name: 'haproxy'
      consul_sd_configs:
      - server: 'localhost:8500'
        services:
          - 'haproxy_exporter'
+   relabel_configs:
+     - source_labels: ['__meta_consul_node']
+       replacement: '$1.example.com'
+       target_label: instance
This tells Prometheus to replace the instance label with the value of the __meta_consul_node label and add .example.com to the end.
Assuming all our machines have hostnames ending in .example.com, this will automatically update the instance label to the hostname of the machines.
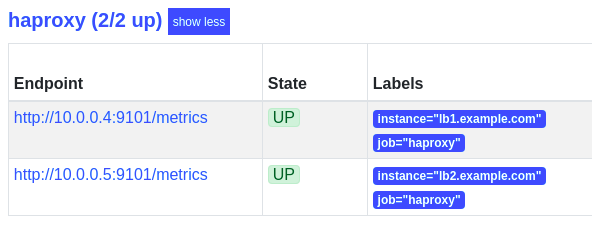
The labels are a lot clearer now:
Where did the __meta_consul_node label come from, and what other labels are available?
__meta_* labels change depending on the type of targets used.
For consul_sd_configs, the documentation lists the following:
__meta_consul_address: the address of the target__meta_consul_dc: the datacenter name for the target__meta_consul_tagged_address_<key>: each node tagged address key value of the target__meta_consul_metadata_<key>: each node metadata key value of the target__meta_consul_node: the node name defined for the target__meta_consul_service_address: the service address of the target__meta_consul_service_id: the service ID of the target__meta_consul_service_metadata_<key>: each service metadata key value of the target__meta_consul_service_port: the service port of the target__meta_consul_service: the name of the service the target belongs to__meta_consul_tags: the list of tags of the target joined by the tag separator
On top of that, we have the default labels included with every metric:
__address__: The IP address / port combination that Prometheus scrapes. If no value is set forinstanceafter relabelling, the value of__address__will be used.__scheme__: The scheme of the target, e.g.http.__metrics_path__: The path to scrape metrics from, e.g./metrics.job: The job name, e.g.haproxy.
A great way to debug the relabelling is to hover over a label in the targets page:
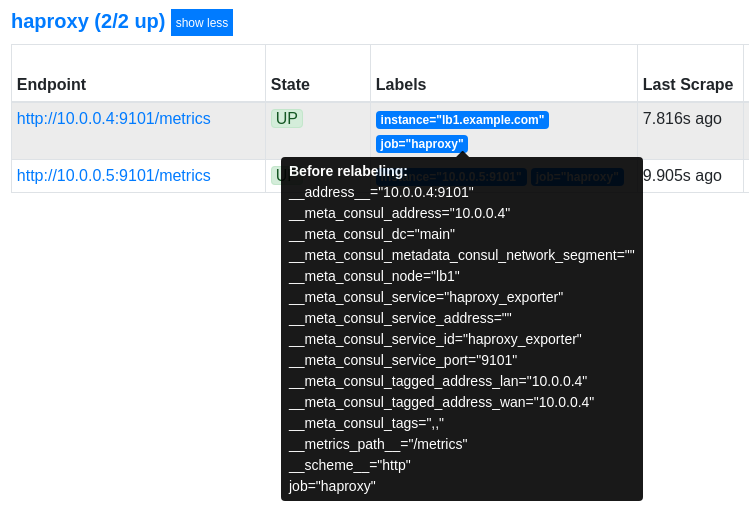
This shows the original labels before relabelling.
In this case we can see the __meta_consul_node value of lb1 was used to set instance to lb1.example.com.
Prometheus drops all labels that begin with __, thus leaving our final two labels, instance=lb1.example.com and job=haproxy.
Conclusion and next steps
In a few steps, we’ve added metrics collection to two HAProxy servers. Thanks to Consul, we can add another instance, register it in the service catalog, and have Prometheus scrape its metrics automatically.
This dynamic target discovery works especially well in fast moving environments, e.g. when using Nomad. Nomad can register every job in Consul, which Prometheus could then scrape.
To learn more about relabelling, Life of a label on the Robust Perception blog is an excellent deep-dive into the available metric labels, including how and when they get assigned.
Need any help getting your Prometheus stack running? Send us an email!